2. Combined building damage#
2.1 Wind building damage#
# Building Wind Fragility mapping
mapping_id = "62fef3a6cef2881193f2261d"
fragility_service = FragilityService(client)
mapping_set = MappingSet(fragility_service.get_mapping(mapping_id))
---------------------------------------------------------------------------
NameError                                 Traceback (most recent call last)
Cell In[1], line 3
      1 # Building Wind Fragility mapping
      2 mapping_id = "62fef3a6cef2881193f2261d"
----> 3 fragility_service = FragilityService(client)
      4 mapping_set = MappingSet(fragility_service.get_mapping(mapping_id))

NameError: name 'FragilityService' is not defined
# wind building damage
w_bldg_dmg = BuildingDamage(client)
w_bldg_dmg.load_remote_input_dataset("buildings", bldg_dataset_id)
w_bldg_dmg.set_input_dataset('dfr3_mapping_set', mapping_set)
w_bldg_dmg.set_parameter("result_name", "Galveston-wind-dmg")
w_bldg_dmg.set_parameter("hazard_type", hazard_type)
w_bldg_dmg.set_parameter("hazard_id", hazard_id)
w_bldg_dmg.set_parameter("num_cpu", 8)
w_bldg_dmg.run_analysis()
True
2.2 Surge-Wave building damage#
# Surge-wave mapping
mapping_id = "6303e51bd76c6d0e1f6be080"
mapping_set = MappingSet(fragility_service.get_mapping(mapping_id))
# surge-wave building damage
sw_bldg_dmg = BuildingDamage(client)
sw_bldg_dmg.load_remote_input_dataset("buildings", bldg_dataset_id)
sw_bldg_dmg.set_input_dataset('dfr3_mapping_set', mapping_set)
sw_bldg_dmg.set_parameter("result_name", "Galveston-sw-dmg")
sw_bldg_dmg.set_parameter("hazard_type", hazard_type)
sw_bldg_dmg.set_parameter("hazard_id", hazard_id)
sw_bldg_dmg.set_parameter("num_cpu", 8)
sw_bldg_dmg.run_analysis()
Dataset already exists locally. Reading from local cached zip.
Unzipped folder found in the local cache. Reading from it...
True
2.3 Inundation (flood) building damage#
# flood mapping
mapping_id = "62fefd688a30d30dac57bbd7"
mapping_set = MappingSet(fragility_service.get_mapping(mapping_id))
# flood building damage
f_bldg_dmg = BuildingDamage(client)
f_bldg_dmg.load_remote_input_dataset("buildings", bldg_dataset_id)
f_bldg_dmg.set_input_dataset('dfr3_mapping_set', mapping_set)
f_bldg_dmg.set_parameter("result_name", "Galveston-flood-dmg")
f_bldg_dmg.set_parameter("hazard_type", hazard_type)
f_bldg_dmg.set_parameter("hazard_id", hazard_id)
f_bldg_dmg.set_parameter("num_cpu", 8)
f_bldg_dmg.run_analysis()
Dataset already exists locally. Reading from local cached zip.
Unzipped folder found in the local cache. Reading from it...
True
2.4 Combine wind, surge-wave and flood building damage#
2.4.1 Hazard exposure example: surge-wave#
surge_wave_damage = sw_bldg_dmg.get_output_dataset("ds_result")
wind_damage = w_bldg_dmg.get_output_dataset("ds_result")
flood_damage = f_bldg_dmg.get_output_dataset("ds_result")
#surge_wave_damage.get_dataframe_from_csv(low_memory=False)

data = surge_wave_damage.get_dataframe_from_csv(low_memory=False)
yes_count = len(data[data['haz_expose'] == 'yes'])
partial_count = len(data[data['haz_expose'] == 'partial'])
sum_count = yes_count + partial_count
total_rows = len(data)

print('Count of "yes":', yes_count)
print('Count of "partial":', partial_count)
print('Sum of "yes" and "partial":', sum_count)
print('Total number of rows:', total_rows)
Count of "yes": 26278
Count of "partial": 744
Sum of "yes" and "partial": 27022
Total number of rows: 29541
2.4.2 Combined damage: setup#
combined_bldg_dmg = CombinedWindWaveSurgeBuildingDamage(client)
result_name = "Galveston-combined-dmg"
combined_bldg_dmg.set_input_dataset("surge_wave_damage", surge_wave_damage)
combined_bldg_dmg.set_input_dataset("wind_damage", wind_damage)
combined_bldg_dmg.set_input_dataset("flood_damage", flood_damage)
combined_bldg_dmg.set_parameter("result_name", result_name)
combined_bldg_dmg.run_analysis()
True
2.4.3 Hazard exposure example: combined#
combined_dmg = combined_bldg_dmg.get_output_dataset("ds_result")
combined_dmg_df = combined_dmg.get_dataframe_from_csv(low_memory=False)

# Display top 5 rows of output data
combined_dmg_df.head()
combined_dmg_df.to_csv('combined_dmg_df.csv', index=False)

data = combined_dmg_df
yes_count = len(data[data['haz_expose'] == 'yes'])
partial_count = len(data[data['haz_expose'] == 'partial'])
sum_count = yes_count + partial_count
total_rows = len(data)

print('Count of "yes":', yes_count)
print('Count of "partial":', partial_count)
print('Sum of "yes" and "partial":', sum_count)
print('Total number of rows:', total_rows)
Count of "yes": 29526
Count of "partial": 11
Sum of "yes" and "partial": 29537
Total number of rows: 29541
2.5 Archetype mapping#
buildings = Dataset.from_data_service(bldg_dataset_id, data_service)
bldg_gdf = buildings.get_dataframe_from_shapefile()
bldg_gdf.head()
Dataset already exists locally. Reading from local cached zip.
Unzipped folder found in the local cache. Reading from it...
| strctid | parid | struct_typ | year_built | no_stories | a_stories | b_stories | bsmt_type | sq_foot | gsq_foot | ... | ffe_elev | g_elev | archetype | arch_wind | arch_flood | arch_sw | csv_guid | csv_sector | csv_val_st | geometry | |
|---|---|---|---|---|---|---|---|---|---|---|---|---|---|---|---|---|---|---|---|---|---|
| 0 | STf3a21b5f-0334-4d77-911f-faa9a45c92d7 | 0 | NaN | 1980 | 2 | 0 | 0 | 0 | 47927 | 0 | ... | 3.76991 | 3.46511 | 0 | 15 | 6 | 15 | NaN | NaN | NaN | POINT (-94.81680 29.31409) |
| 1 | ST80ab0289-8c72-4699-b12b-08ef2f2a5c91 | 0 | NaN | 1954 | 1 | 0 | 0 | 0 | 100796 | 0 | ... | 2.26048 | 1.95568 | 0 | 15 | 6 | 15 | NaN | NaN | NaN | POINT (-94.82295 29.29635) |
| 2 | ST7916eaa8-0bfa-4b32-84ff-20f19a520f5c | 0 | NaN | 1970 | 1 | 0 | 0 | 0 | 27121 | 0 | ... | 2.68011 | 2.37531 | 0 | 15 | 6 | 15 | 7916eaa8-0bfa-4b32-84ff-20f19a520f5c | IRetail | 2435054.5 | POINT (-94.82423 29.29098) |
| 3 | ST79008971-a534-4e45-9e40-43a2a904e59b | 0 | NaN | 2002 | 1 | 0 | 0 | 0 | 126333 | 0 | ... | 2.91465 | 2.60985 | 0 | 15 | 6 | 15 | 79008971-a534-4e45-9e40-43a2a904e59b | IProfSer | 4483599 | POINT (-94.84045 29.29117) |
| 4 | ST2ad8ab6f-057f-468e-9911-6e92d9d4d01f | 0 | NaN | 2002 | 1 | 0 | 0 | 0 | 114544 | 0 | ... | 3.73770 | 3.43290 | 0 | 15 | 6 | 15 | 2ad8ab6f-057f-468e-9911-6e92d9d4d01f | IRealE | 282702.06 | POINT (-94.84242 29.29059) |
5 rows × 38 columns
arch_mapping = Dataset.from_data_service("63dc1f1362b9d001e6a1b485", data_service).get_dataframe_from_csv()
arch_mapping
| arch_wind | category | cluster | |
|---|---|---|---|
| 0 | 12.0 | Critical Facilities | Critical Medical - Acute Care Hospitals |
| 1 | 14.0 | Critical Facilities | Emergency Operations Centers |
| 2 | 11.0 | Critical Facilities | Critical Government - First Responder Facilities |
| 3 | NaN | Critical Facilities | Non-ambulatory Facilities - Prisons, nursing h... |
| 4 | NaN | Emergency Housing | Emergency Shelters |
| 5 | NaN | Emergency Housing | Residential Housing |
| 6 | NaN | Emergency Housing | SFH and Multi-family |
| 7 | NaN | Housing / Neighborhood | Critical Retail |
| 8 | 13.0 | Housing / Neighborhood | Religious and Spiritual Centers |
| 9 | 1.0 | Housing / Neighborhood | Residential Housing |
| 10 | 2.0 | Housing / Neighborhood | Residential Housing |
| 11 | 3.0 | Housing / Neighborhood | Residential Housing |
| 12 | 4.0 | Housing / Neighborhood | Residential Housing |
| 13 | 5.0 | Housing / Neighborhood | Residential Housing |
| 14 | 17.0 | Housing / Neighborhood | Residential Housing |
| 15 | NaN | Housing / Neighborhood | SFH and Multi-family |
| 16 | 9.0 | Housing / Neighborhood | K-12 Schools |
| 17 | 10.0 | Housing / Neighborhood | K-12 Schools |
| 18 | NaN | Housing / Neighborhood | Child Care Centers |
| 19 | NaN | Housing / Neighborhood | Hotels and Motels |
| 20 | 7.0 | Community Recovery | Business - Manufacturing |
| 21 | 8.0 | Community Recovery | Business - Manufacturing |
| 22 | 6.0 | Community Recovery | Business - Commodity Services |
| 23 | 15.0 | Community Recovery | Business - Commodity Services |
| 24 | 16.0 | Community Recovery | Business - Commodity Services |
| 25 | 18.0 | Community Recovery | Business - Commodity Services |
| 26 | 19.0 | Community Recovery | Business - Service Professions |
| 27 | NaN | Community Recovery | Conference & Event Venues |
| 28 | NaN | Community Recovery | Other |
max_dmg_state_df = DataProcessUtil.get_max_damage_state(combined_dmg_df)
max_dmg_state_df
| guid | max_prob | max_state | |
|---|---|---|---|
| 0 | f3a21b5f-0334-4d77-911f-faa9a45c92d7 | 0.656011 | DS_0 |
| 1 | 80ab0289-8c72-4699-b12b-08ef2f2a5c91 | 0.711510 | DS_2 |
| 2 | 7916eaa8-0bfa-4b32-84ff-20f19a520f5c | 0.896200 | DS_0 |
| 3 | 79008971-a534-4e45-9e40-43a2a904e59b | 0.695918 | DS_0 |
| 4 | 2ad8ab6f-057f-468e-9911-6e92d9d4d01f | 0.575940 | DS_0 |
| ... | ... | ... | ... |
| 29536 | 1ac5be10-582c-46b2-91ed-469f684bb886 | 0.999993 | DS_3 |
| 29537 | fbcfb6d6-de13-42fa-9839-d7c80afc651d | 0.357067 | DS_2 |
| 29538 | 2ee961c9-cd94-499e-b1fe-3e0220a440ea | 0.545299 | DS_2 |
| 29539 | fa15cfbc-8a60-4a3f-b40f-7a6fada625b9 | 0.678298 | DS_0 |
| 29540 | 3a8a9360-48b1-4399-950d-d32969b0a381 | 0.678298 | DS_0 |
29541 rows × 3 columns
ret_json = DataProcessUtil.create_mapped_dmg_result(bldg_gdf, max_dmg_state_df, arch_mapping, "max_state", "arch_wind")
ret_json
{'by_cluster': [{'category': 'Critical Facilities',
   'cluster': 'Critical Medical - Acute Care Hospitals',
   'DS_0': 10,
   'DS_1': 5,
   'DS_2': 0,
   'DS_3': 0},
  {'category': 'Critical Facilities',
   'cluster': 'Emergency Operations Centers',
   'DS_0': -1,
   'DS_1': -1,
   'DS_2': -1,
   'DS_3': -1},
  {'category': 'Critical Facilities',
   'cluster': 'Critical Government - First Responder Facilities',
   'DS_0': -1,
   'DS_1': -1,
   'DS_2': -1,
   'DS_3': -1},
  {'category': 'Critical Facilities',
   'cluster': 'Non-ambulatory Facilities - Prisons, nursing homes, etc.',
   'DS_0': -1,
   'DS_1': -1,
   'DS_2': -1,
   'DS_3': -1},
  {'category': 'Emergency Housing ',
   'cluster': 'Emergency Shelters',
   'DS_0': -1,
   'DS_1': -1,
   'DS_2': -1,
   'DS_3': -1},
  {'category': 'Emergency Housing ',
   'cluster': 'Residential Housing',
   'DS_0': -1,
   'DS_1': -1,
   'DS_2': -1,
   'DS_3': -1},
  {'category': 'Emergency Housing ',
   'cluster': 'SFH and Multi-family',
   'DS_0': -1,
   'DS_1': -1,
   'DS_2': -1,
   'DS_3': -1},
  {'category': 'Housing / Neighborhood',
   'cluster': 'Critical Retail',
   'DS_0': -1,
   'DS_1': -1,
   'DS_2': -1,
   'DS_3': -1},
  {'category': 'Housing / Neighborhood',
   'cluster': 'Religious and Spiritual Centers',
   'DS_0': -1,
   'DS_1': -1,
   'DS_2': -1,
   'DS_3': -1},
  {'category': 'Housing / Neighborhood',
   'cluster': 'Residential Housing',
   'DS_0': 4950,
   'DS_1': 1731,
   'DS_2': 17259,
   'DS_3': 2943},
  {'category': 'Housing / Neighborhood',
   'cluster': 'SFH and Multi-family',
   'DS_0': -1,
   'DS_1': -1,
   'DS_2': -1,
   'DS_3': -1},
  {'category': 'Housing / Neighborhood',
   'cluster': 'K-12 Schools',
   'DS_0': 10,
   'DS_1': 0,
   'DS_2': 2,
   'DS_3': 0},
  {'category': 'Housing / Neighborhood',
   'cluster': 'Child Care Centers',
   'DS_0': -1,
   'DS_1': -1,
   'DS_2': -1,
   'DS_3': -1},
  {'category': 'Housing / Neighborhood',
   'cluster': 'Hotels and Motels',
   'DS_0': -1,
   'DS_1': -1,
   'DS_2': -1,
   'DS_3': -1},
  {'category': 'Community Recovery',
   'cluster': 'Business - Manufacturing',
   'DS_0': 48,
   'DS_1': 18,
   'DS_2': 5,
   'DS_3': 17},
  {'category': 'Community Recovery',
   'cluster': 'Business - Commodity Services',
   'DS_0': 646,
   'DS_1': 709,
   'DS_2': 1019,
   'DS_3': 27},
  {'category': 'Community Recovery',
   'cluster': 'Business - Service Professions',
   'DS_0': 31,
   'DS_1': 1,
   'DS_2': 110,
   'DS_3': 0},
  {'category': 'Community Recovery',
   'cluster': 'Conference & Event Venues',
   'DS_0': -1,
   'DS_1': -1,
   'DS_2': -1,
   'DS_3': -1},
  {'category': 'Community Recovery',
   'cluster': 'Other',
   'DS_0': -1,
   'DS_1': -1,
   'DS_2': -1,
   'DS_3': -1}],
 'by_category': [{'category': 'Critical Facilities',
   'DS_0': 10,
   'DS_1': 5,
   'DS_2': 0,
   'DS_3': 0},
  {'category': 'Emergency Housing ',
   'DS_0': -1,
   'DS_1': -1,
   'DS_2': -1,
   'DS_3': -1},
  {'category': 'Housing / Neighborhood',
   'DS_0': 4960,
   'DS_1': 1731,
   'DS_2': 17261,
   'DS_3': 2943},
  {'category': 'Community Recovery',
   'DS_0': 725,
   'DS_1': 728,
   'DS_2': 1134,
   'DS_3': 44}]}
merged_gdf = bldg_gdf[['guid', 'geometry']].merge(max_dmg_state_df, left_on='guid', right_on='guid')
merged_gdf
| guid | geometry | max_prob | max_state | |
|---|---|---|---|---|
| 0 | f3a21b5f-0334-4d77-911f-faa9a45c92d7 | POINT (-94.81680 29.31409) | 0.656011 | DS_0 |
| 1 | 80ab0289-8c72-4699-b12b-08ef2f2a5c91 | POINT (-94.82295 29.29635) | 0.711510 | DS_2 |
| 2 | 7916eaa8-0bfa-4b32-84ff-20f19a520f5c | POINT (-94.82423 29.29098) | 0.896200 | DS_0 |
| 3 | 79008971-a534-4e45-9e40-43a2a904e59b | POINT (-94.84045 29.29117) | 0.695918 | DS_0 |
| 4 | 2ad8ab6f-057f-468e-9911-6e92d9d4d01f | POINT (-94.84242 29.29059) | 0.575940 | DS_0 |
| ... | ... | ... | ... | ... |
| 29536 | 1ac5be10-582c-46b2-91ed-469f684bb886 | POINT (-94.78968 29.28593) | 0.999993 | DS_3 |
| 29537 | fbcfb6d6-de13-42fa-9839-d7c80afc651d | POINT (-94.79154 29.28914) | 0.357067 | DS_2 |
| 29538 | 2ee961c9-cd94-499e-b1fe-3e0220a440ea | POINT (-94.78782 29.29591) | 0.545299 | DS_2 |
| 29539 | fa15cfbc-8a60-4a3f-b40f-7a6fada625b9 | POINT (-94.79564 29.29522) | 0.678298 | DS_0 |
| 29540 | 3a8a9360-48b1-4399-950d-d32969b0a381 | POINT (-94.79652 29.29500) | 0.678298 | DS_0 |
29541 rows × 4 columns
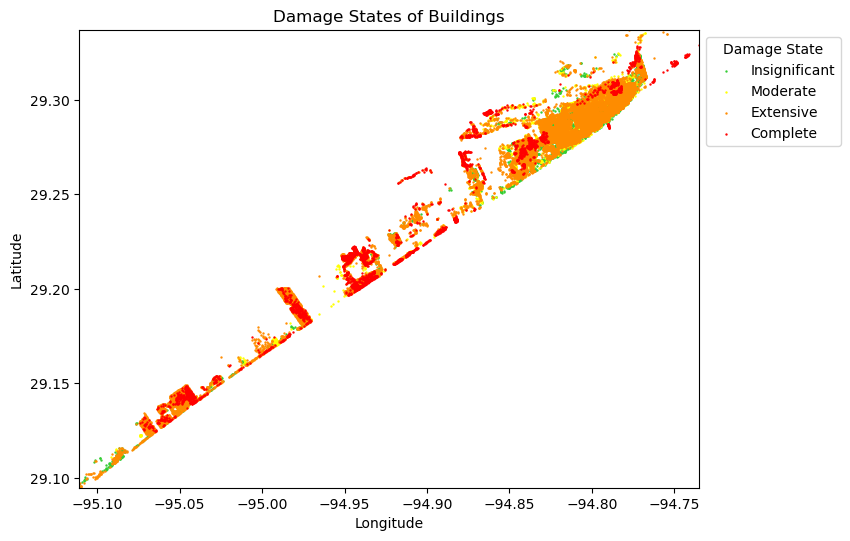
2.6 Plot results#
2.6.1 Combined building damage#
# Rename 'max_state' values for the legend
merged_gdf['max_state'] = merged_gdf['max_state'].replace({'DS_0': 'Insignificant',
                                                           'DS_1': 'Moderate',
                                                           'DS_2': 'Extensive',
                                                           'DS_3': 'Complete'})

# Define colors for each 'max_state'
colors = {'Insignificant': 'limegreen', 'Moderate': 'yellow', 'Extensive': 'darkorange', 'Complete': 'red'}

# Function to plot the data with different colors for each 'max_state'
def plot_data(point_size, use_basemap=True):
    # Plotting
    fig, ax = plt.subplots(figsize=(8, 8))
    ax.set_facecolor('white')  # Set axes background to white

    # Determine bounds from the data
    bounds = merged_gdf.total_bounds
    ax.set_xlim([bounds[0], bounds[2]])
    ax.set_ylim([bounds[1], bounds[3]])

    # Plot each category with its color
    for state, color in colors.items():
        data_to_plot = merged_gdf[merged_gdf['max_state'] == state]
        data_to_plot.plot(ax=ax, markersize=point_size, color=color, label=state)

    # Add basemap if requested
    if use_basemap:
        try:
            ctx.add_basemap(ax, crs=merged_gdf.crs.to_string(), source=ctx.providers.CartoDB.Positron)
        except Exception as e:
            print(f"Failed to load basemap: {e}")

    # Add legend and labels
    plt.legend(title='Damage State', loc='upper left', bbox_to_anchor=(1, 1))
    plt.title('Damage States of Buildings')
    plt.xlabel('Longitude')
    plt.ylabel('Latitude')

    # Show plot
    plt.show()

# Example usage
plot_data(point_size=0.5, use_basemap=False)
2.6.2 Paper figure#
